

Thank you for your interest in the latest dunnhumby Retailer Preference Index.
If your company is in our report and you'd like your complimentary custom retailer profile, contact us through the form and somebody will be in touch shortly.
Request your complimentary custom retailer profile
View more recent thought leadership below:
Blogs and Reports

Blog | The 50,000 Square Foot Convenience Store
A new format in grocery retail is emerging: the 50,000 square foot convenience store. Its value proposition to customers is simple: higher quality perishables and ready-to-eat items than your typical grocery store. Thousands of the same center-store products you can also find at Walmart, Target, Amazon, Costco and Sam’s Club. Everything at higher prices. Added bonus: since the store is 10x to 20x bigger than your typical c-store, you can get your steps in and burn calories at the same time.
Wait, what?
Keep reading to find out more.
Report | 2018 Retailer Preference Index: Convenience, Drug, and Dollar Channel Edition
In dunnhumby’s second edition of the Retailer Preference Index (RPI) study, a comprehensive nationwide study, we explore the evolving US Convenience, Dollar, and Drug channels to help retailers navigate an increasingly difficult market. The study focuses on the following questions:
- What drives retailer preference among shoppers of smaller format grocery channels?
- What retailers are winning and losing? And why?
- What can retailers do to improve performance?
Webinars and Videos

Webinar On-Demand | What Makes a Retail Winner: The New Rules for Success
Retail success takes many forms in today’s dynamic marketplace. From large legacy retailers to disruptive start-ups and all manner of competitors in between, the paths to retail success involves common principals around which there is a wide variation of understanding and execution.
To bring clarity to the issue of what makes a winner, dunnhumby conducted a survey of more than 7,000 U.S. shoppers for the second annual Retailer Preference Index (RPI), the first study of its kind in the industry. In what’s quickly become known as retailing’s equivalent of research firm Gartner’s often-cited Magic Quadrant, dunnhumby’s RPI is a ranking of more than 50 large food and consumable retailers based on a combination of shopper sentiment and financial performance.
Join Retail Leader and dunnhumby’s Jose Gomes, President of North America, and Erich Kahner, Associate Director of Strategy, for a deep dive into the RPI, the levers for success, and an unvarnished look at why some retailers win and others don’t.
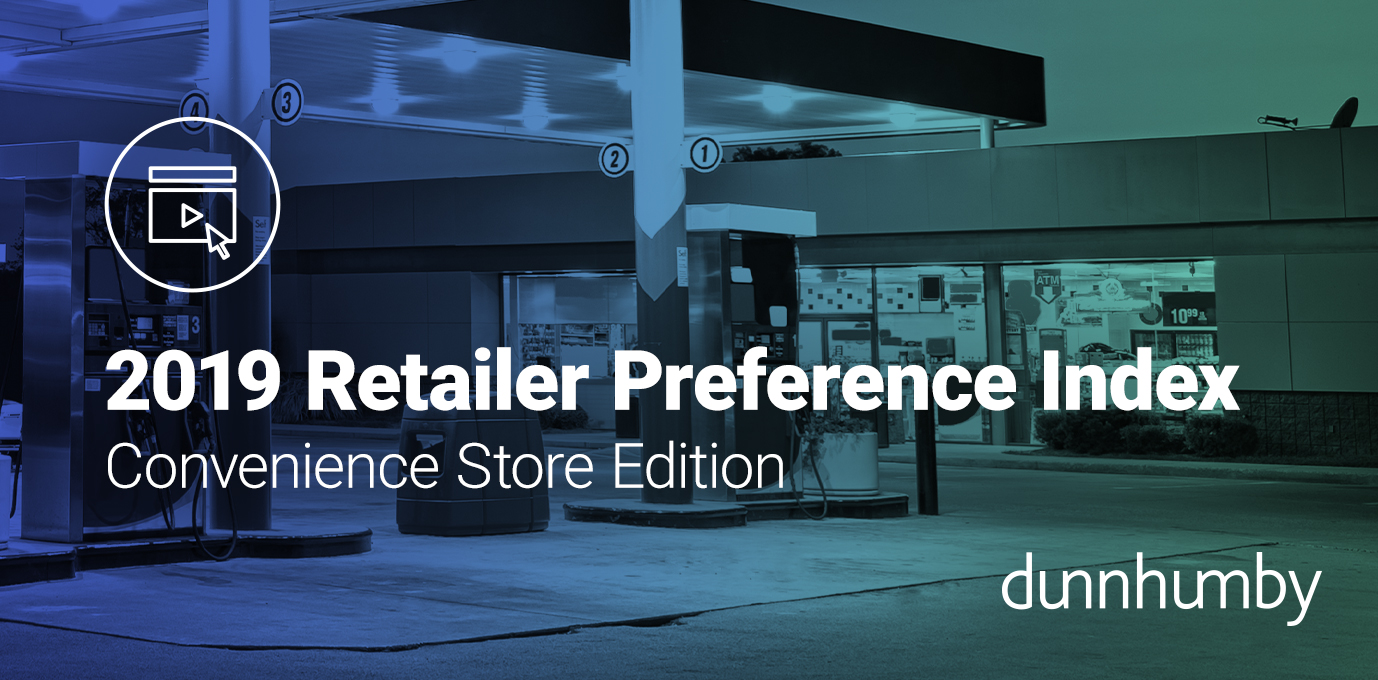
Video | Top Insights from the 2019 dunnhumby Retailer Preference Index: Convenience Channel Edition
In October 2019, we published our 2nd edition of the Retailer Preference Index: Convenience Channel edition to explore the $654.3 billion market. Our goal: to understand what drives consumer preference for the top 27 U.S. Convenience retailers based on responses from around 7,000 U.S. households. This is the first study that quantifies retailer preference, based on a combination of emotional connection and retailer preference.
Watch the video for a few of the key takeaways for retailers to consider.
© 2019 dunnhumby | Terms & Conditions | Privacy Notice | Cookie Notice | Non-compliance Policy | Modern Slavery Statement | Accessibility